Why We Like Aggressive Capital Allocators
The Power of Reinvesting Gross Profits the Right Way
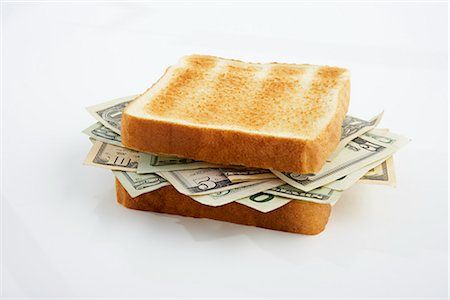
At some point or another, we've all heard the phrase "you have to spend money to make money", typically during an introductory Business or Economics class coupled with a simple and informative application of why the aforementioned phrase is true (though not guaranteed!).
In most instances, the lesson is coupled with a case study involving a visit to the grocery store with $10 (or $20 in today's money!) to acquire the necessary ingredients required to make a handful of sandwiches. Assuming one can use the $10 to acquire all of the "goods" needed to make 10 sandwiches, and each of those sandwiches can then be sold to fellow students for $2 each, the savvy entrepreneur can find himself netting $10 of gross profit ($20 revenues - $10 cost of goods); we'll ignore taxes for the time being. The entrepreneur then has a follow up choice:
a) No Reinvestment: quit altogether and keep/spend his money ($10 initial investment + $10 profits)
b) Some Reinvestment: pocket his original investment of $10 and then return to the grocery store to re-run the basic 10 sandwich sale scenario with another $10 (profits) to try to earn an incremental $10 ($20 revenues - $10 cost of goods)
c) Aggressive Reinvestment: reinvest the aggregate $20 (initial investment + profits) by returning to the grocery store to acquire the ingredients needed to make 20 sandwiches this time in search of sales demand that will double his profits to $20 ($40 revenues - $20 cost of goods)
Businesses of all sizes are faced with these types of reinvestment decisions on a daily basis - albeit usually slightly more complex - factoring in the current economic environment, total addressable markets, industry-specific supply/demand considerations, company-level operating capacity, etc.
As we've commented previously, we like to invest in businesses that are VERY aggressive with their reinvestment efforts, particularly when they have demonstrated strong returns on invested capital ("ROIC") profiles over a period of time. To drive long-term business value expansion, most executives are charged with growing their gross profit buckets over time (revenues - cost of goods sold). Expanding these dollars gives them incremental "reinvestment budget" firepower to allocate accordingly across the growth/optimization/maintenance activities required to drive future growth and compounding profits for the benefit of employees and shareholders.
These "reinvestments" typically occur in the form of: i) SG&A spending (via sales & marketing expenses or research & development spend); ii) Capital Expenditures/Software Development Costs (via new plant initiatives or technology/process enhancements); or iii) Acquisitions/JV Partnerships (targeting complementary businesses with adjacent products/services or new lines of commercial activity altogether). While each investment bucket has a different return profile, in both dollar return terms and time horizon, the goal is to earn an attractive payback in excess of the underlying cost of capital in a reasonable timeframe. For example, the addition of new salespeople may pay off quickly via signed contracts, whereas the expansion of a plant or new production line may take longer to yield a solid return due to the long-tail building and development requirements.
As investors across both Private and Public companies, we assess 3 primary things in our initial due diligence.
Aggressiveness - how aggressive is the current and forward-looking capital allocation plan (as measured by Free Cash Flow yield)?
Efficiency - how effective has the return profile of these capital investments been over a multi-year or full-cycle period (as measured by ROIC efficiency)?
Valuation - how attractive is the underlying risk/reward profile of the business at its present valuation (as measured by the upside/downside skew)?
We have talked about these dynamics in greater detail in a previous blog post.
While many investors like free cash flow to be distributed back to them, typically in the form of dividends or share repurchases, investors/portfolio managers are then faced with their own reallocation and reinvestment decisions. In certain situations, this is the right choice for both the company holding excess cash and investors seeking alternative investment opportunities. However, that alternative can potentially create higher volatility or inefficient outcomes vs. an executive team that leverages its existing operational infrastructure to engage targeted reinvestment activities to amplify returns and compound value creation in an effective manner.
It’s a reminder that not all aggressive capital allocation plans are equal and, therefore, trying to measure the efficiency of a business’s idiosyncratic ROIC profile is so important in our process.
To translate these concepts into our actual investment activities, we've spent time analyzing public market data and stock market outcomes to try to common size the impact of various levels of capital allocation aggressiveness and ROIC efficiency across a wide population of businesses, regardless of industry. We've also benchmarked this data against some of the best performers in the stock market over the last decade to confirm that our customized ROIC metrics correlate strongly to underlying share price performance.
When ranked by our internal "Moneyball" indicator (as we call it), which is a customized composite metric that scores a Company by its cumulative ability to generate durable shareholder value creation through strong multi-period ROIC efficiency, here are the high-level outcomes across a population of nearly 200 companies with varying market capitalizations:
- The Top 25 ranking names have average full cycle FCF yield of 1.0% with average 10-year equity compounded annual growth rates (CAGRs) of 33%
- The Top 50 ranking names have average full cycle FCF yield of 1.7% with average 10-year equity CAGRs of 26%
- The Bottom 25 ranking names have average full cycle FCF yield of 7.0% with average 10-year equity CAGRs of 5%
- The Bottom 50 ranking names have average full cycle FCF yield of 4.4% with average 10-year equity CAGRs of 5%
Note: Our measure of Free Cash Flow ("FCF") Yield reflects (Cash Flow from Operations - Capital Expenditures - Acquisitions) / Market Cap.
This data highlights the influence of both aggressive capital allocation (low FCF Yield) and efficient ROIC profiles (high "Moneyball" score) into compounding shareholder value over time. Thus, while there are always other quantitative factors and qualitative assessments we evaluate in our underwriting activities, we want to continue to focus on targeting investments that benchmark well against our top quartile rankings to improve the likelihood of generating strong long-term returns while also reducing short-term risk.
Loosely, we believe long-term shareholder value creation typically occurs in one of four distinct ways. First, by creating a new commercially viable product or service category and becoming the dominant first mover to capture market share or creating a new product or service that steals market share from legacy incumbents. Second, the traditional "razor/razor blade" model whereby mission-critical products or installed services generate long-term aftermarket products or services consumables (usually of a higher margin nature). Third, financially healthy cyclical business - or businesses undergoing a temporary dislocation - with high ROIC profiles in stable environments that are trading at distressed prices due to short-term factors out of their day-to-day control but capable of taking advantage of the challenging operating environment to reposition for long-term growth. Fourth, acquirers who have mastered the "hub and spoke" operating model and can create incremental leverage through acquisition activity, particularly if using lower cost debt financing.
Targeting investments in aggressive and efficient capital allocators at attractive valuations is in the DNA of Swingbridge. As we continue to emphasize our high long-term investment return targets, for both Public and Private Equity holdings, being fueled by investments in businesses with FCF yields of -2% to 2%, the reason is simple: you have to spend money to make money.
Join Our Blog Email List
Sign up to receive our latest blog posts directly to your email as they are published.
Let's Talk
Did this article spark a question?
Want to learn more about Swingbridge or how to work together?
Feel free to reach out.
Contact Us
Thank you for contacting us.
We will get back to you as soon as possible.
Subscribe to the Blog
More from Swingbridge